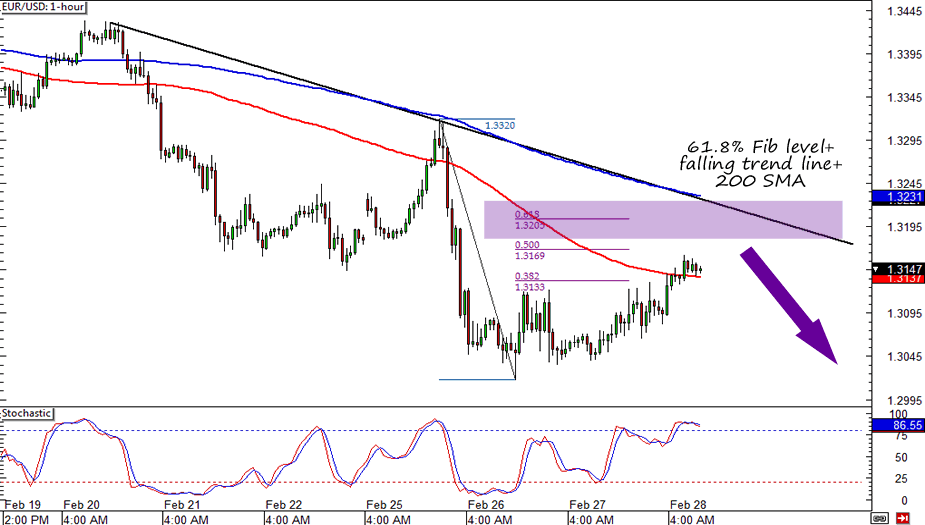
When a same trade signal comes from various technical analysis then Confluence occurs.
Usually, these are technical indicators, but may also be combined with chart patterns, price action, and chart overlay tools.
The term Confluence is originally used for the geographic point where two or more rivers are joined together
Now it is also used in the trading context using same logic for the description of Confluence of many signals of the trading
A confluence of indicators creating a strong resistance area consisting of is given in the chart given below:
-
A descending trendline
-
200 SMA acting as a dynamic resistance level
-
61.8% Fibonacci retracement level
-
RSI showing an “oversold” reading

Other examples of confluence are:
-
RSI signaling oversold and the price is trading near a support level.
-
A trendline coming together at the bottom of the Bollinger Band.
-
Price trading near its 200 SMA, the 50% Fibonacci retracement level meeting, and a major support level.
The concept of Confluence can be summarized as:
“An area in the market where two or more structures come together to form a high-probability buy/sell zone.’
The confluence of trade signals can give a greater accuracy and profitability.
When one or more
trading technique or analysis is combined to increase the odds of a winning trade, it is called Confluence Trading.
Various trading indicators can be used that all give the same “reading”, as a way to confirm the validity of a potential
buy or sell signal.
Confluence refers to any circumstance where you see multiple trade signals lining up on your charts and telling you to take a trade.
For example, if you use a single technical analysis tool that has a 40% accuracy rate
for predicting price movements, and then interconnected technical analysis to further filter your decision By using the tool, you increase your odds of winning.
In other words, you use the concept of "confluence" to find trading setups
using a variety of technical analysis methods, and all these independent forms of analysis indicate similar directional price movements.
For example, this occurs when support and resistance levels are combined with Fibonacci retracement and
extension levels.
Psychological levels, back heights and lows, and dynamic support and resistance levels (such as the Moving Average or Bollinger Bands) can also serve as areas of interest.
When these levels meet, they form strong support
or resistance levels, which can happen as entry points or take profit levels.
A
Abandoned Baby | Account Statement Report | Account Value | Accumulation Area | Accumulative Swing Index ASI | Address | ADDY | ADP National Employment Report | Advance Or Decline Index | Afghanistan Afghanis | Agency Model | Aggressor | Alan Bollard | Alan Greenspan | Albania Leke | Algerian Algeria Dinars | Alligator | Altcoin | Analysts | Andrews Pitchfork | Angela Merkel | Angola Kwanza | Anti Money Laundering AML | ANZ Commodity Price Index | Application Programming Interface API | Appreciation | Arbitrage | Argentina Pesos | Armenian Drams | Aroon Oscillator | Aroon Up And Down | Aruban Guilder | Ascending Channel | Ascending Trend Line | Ascending Triangle | ASIC Mining | Asset | Asset Purchase Programme APP | Asset Purchases | Asymmetric Encryption | Asymmetric Slippage
B
Bag | Bag Holder | Bahmas Dollars | Bahrain Dinars | Bail In | Bail Out | Balance Of Trade | Baltic Dry Index | Bangladesh Taka | Bank Levy | Bank Of Canada BOC | Bank Of England BOE | Bank Of International Settlement BIS | Bank Of Japan BoJ | Bank Run | Bank Run | Banking Institutions | Bar Chart | Barbados Dollars | Base Currency | Base Rate | Basing | Basing Point | Bear | Bear Flag | Bear Market | Bear Trap | Bearish | Binary Options | Bitcoin Cash | Bitcoin Maximalist | Bitcoin Or BTC | Block | Block Explorer | Block Header | Block Height | Block Reward | Blockchain | Blue Chip | Bolivia Bolivianos | Bollinger Bands | Bond | Bond Auction | Bond Yeild | Book | Boris Schlossberg | Botswana Pulas | Brazilian Brazil Real | Breakdown | Breakeven | Breakout | Brent Crude | Bretton Woods Agreement Of 1944 | BRIC | Broadening Formation | Broker | BTD | BTFD | Bucket Shop | Bulgarian Leva | Bull | Bull Flag | Bull Market | Bull Trap | Bullish | Bullish Engulfing Pattern | Bundesbank | Burundi Francs | Business Inventories | Buy Side | Buying Pressure
C
Cable | Camarilla Pivot Points | Cambist | Cambodian Riels | Canadian Dollar | Cape Verde Escudos | Carbon Credits | Cardano ADA | Carry Trade | Cash Market | Catalyst | Cayman Islands Dollars | Cboe Eurocurrency Volatility Index | Central Bank | Central Bank Digital Currency | Central Bank Intervention | Central Counterparty Clearing Houses CCPs | Central Limit Order Book Or CLOB | Chaikin Oscillator | Chart Pattern | Chartist | Chicago PMI | Chilean Peso | Chinese Renminbi | Chinese Yuan | Christine Lagarde | Circulating Supply | Cleared Funds | Clearing | Clearing Price | Client | Closed Position | Cloud Mining | Coin Age | Cold Storage | Collateral | Colombian Pesos | Comdoll | Commercial Corporations | Commission | Commitments Of Traders Report Or COT | Commodity | Commodity Channel Index Or CCI | Commodity Futures Trading Commission CFTC | Commodity Research Bureau Index | Commodity Trading Advisor CTA | Communaute Financiere Africaine Francs | Comoros Francs | Completeness | Compound COPM | Comptoirs Francais Du Pacifique Francs | Conference Board Consumer Confidence Index CCI | Confirmation | Confluence | Congo Congolese Francs | Consensus Algorithm | Consolidation | Consumer Price Index CPI
ForexTrading.pk